Mike Alkin argues that depleted inventories, fading secondary supply and sharply rising mining costs are reshaping uranium price formation.
By Lucijan Valkovic | Triangle Investor
Based on a conversation with Mike Alkin of Sachem Cove Capital Management and his October 2026 NEI International Fuel Seminar presentation.
The central question: what happens when the bridge runs out?
For much of the past decade, uranium buyers and market forecasters were able to reconcile reactor demand with available supply by relying on more than current mine production. Commercial inventories were drawn down, while enrichment underfeeding supplied additional uranium-equivalent material to the market. On paper, those sources helped make an increasingly tight market appear adequately supplied—or even oversupplied.
Mike Alkin, founder of Sachem Cove Capital Management, argues that this accounting obscured the underlying balance. Mine production is a recurring flow; inventories are a finite stock. A market can bridge a structural flow deficit by consuming stockpiles, but it cannot do so indefinitely. In his view, the uranium market is approaching the point where the remaining inventory cushion and secondary supply can no longer disguise the weakness in primary supply.
Alkin’s core message at the Nuclear Energy Institute’s 2026 International Fuel Seminar was consistent with the argument he says he made at the same conference in 2018 and 2019: the industry’s cost curve was too low, and the market was underestimating the price required to sustain existing production and incentivize replacement supply.
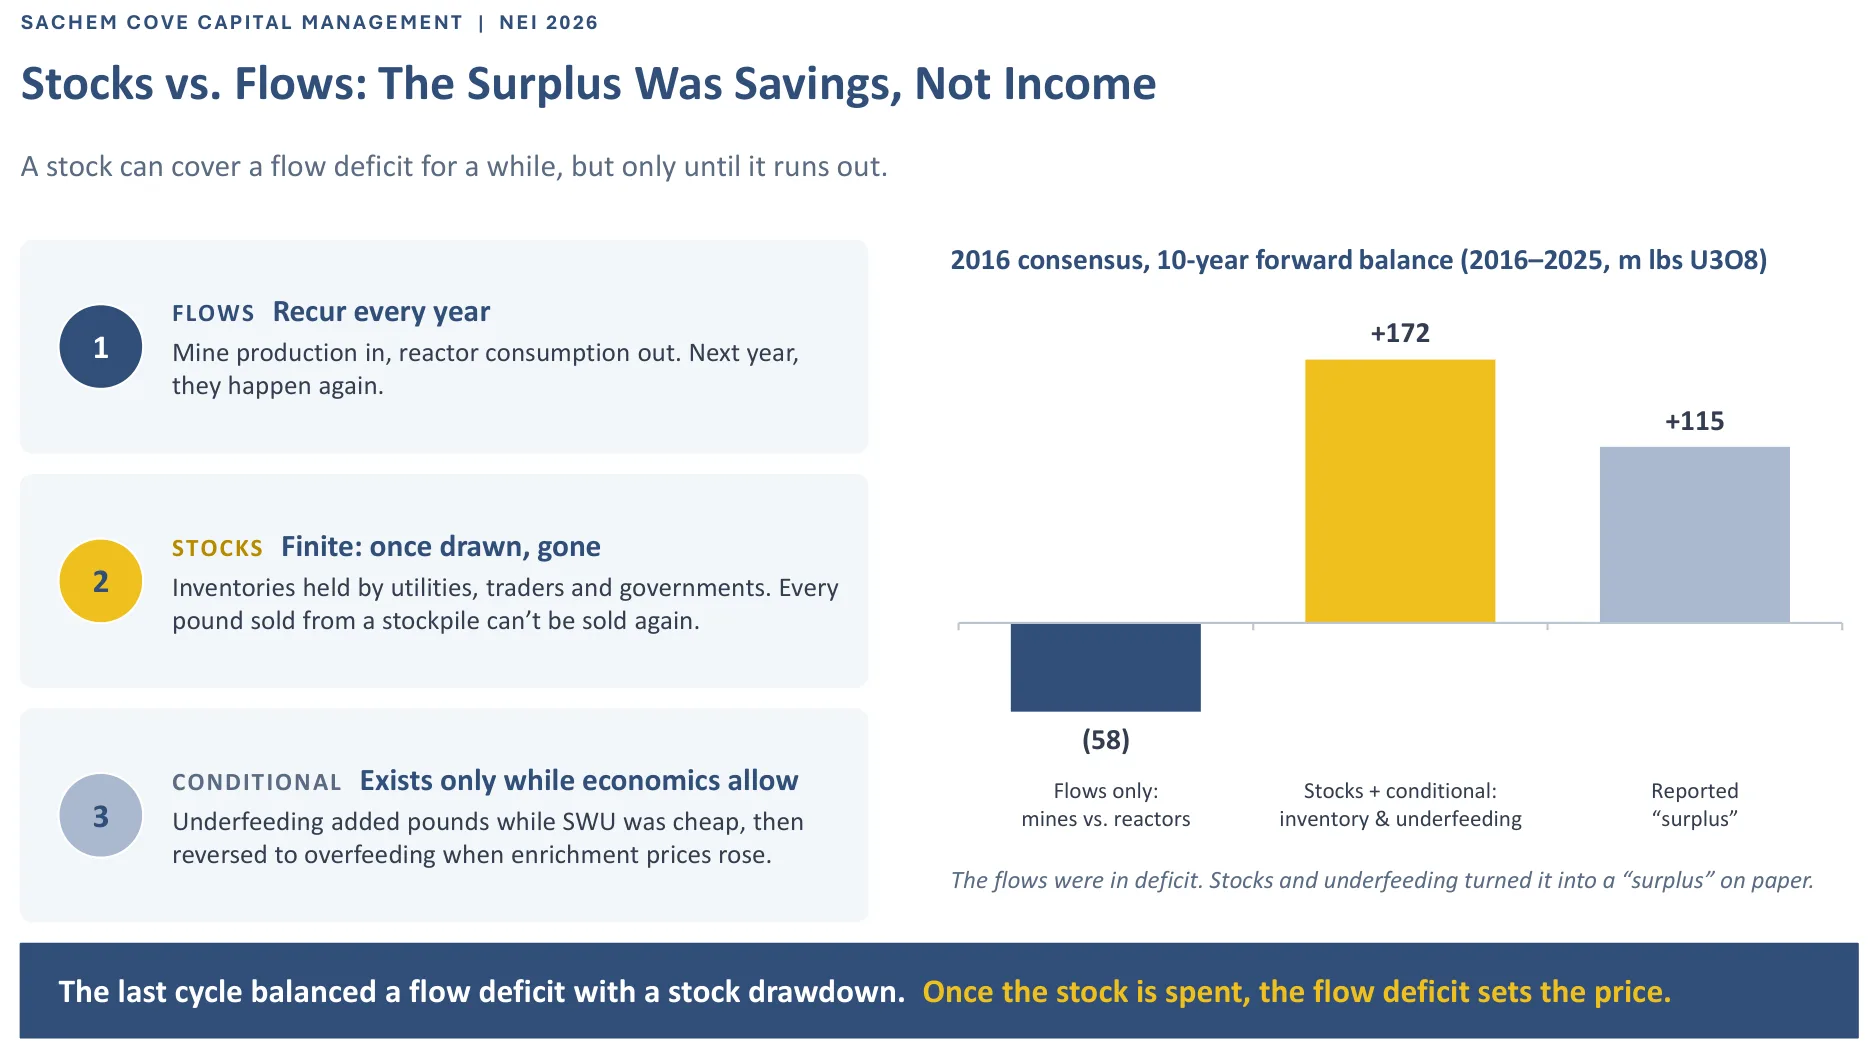
Figure 1. Sachem Cove’s stocks-versus-flows framework: the 2016 consensus showed a 115-million-pound
“surplus” once inventories and underfeeding were included, while the underlying mine-versus-reactor balance was a 58-million-pound deficit. Source: Sachem Cove Capital Management / UxC presentation, slide 4
How a structural deficit became a paper surplus
Alkin revisited the industry’s 2016 outlook. The consensus ten-year forward balance appeared to show a surplus of roughly 115 million pounds of U3O8. But, he explained, that headline number blended recurring mine supply with two sources that were conditional or finite: inventory drawdowns and enrichment underfeeding.
The distinction matters. Mine output is produced again each year, while a pound sold from an inventory stockpile is no longer available to be sold again. Underfeeding, meanwhile, depends on enrichment economics. When enrichment capacity is abundant and separative work unit (SWU) prices are low, enrichers can obtain more uranium from the same feed material. If those economics reverse, underfeeding can decline or turn into overfeeding, potentially increasing uranium feed requirements.
Removing inventory drawdowns and underfeeding from the historical forward balance changes the picture substantially. Sachem Cove’s presentation depicts the underlying flows as being in deficit, even though the combination of flows, stocks and conditional secondary supply produced a reported surplus. Alkin’s conclusion is not that the market’s accounting was necessarily arithmetically wrong; rather, it failed to account adequately for whether the secondary pounds would actually be available at the price and time buyers needed them.
“The last cycle balanced a flow deficit with a stock drawdown. Once the stock is spent, the flow deficit sets the
price.”
That is the framework through which Alkin interprets the uranium market’s evolution from the post-Fukushima period to today. A market can appear well supplied while inventories are available and willing holders are prepared to sell. Once those conditions change, the balance between current production and reactor requirements becomes much more important.
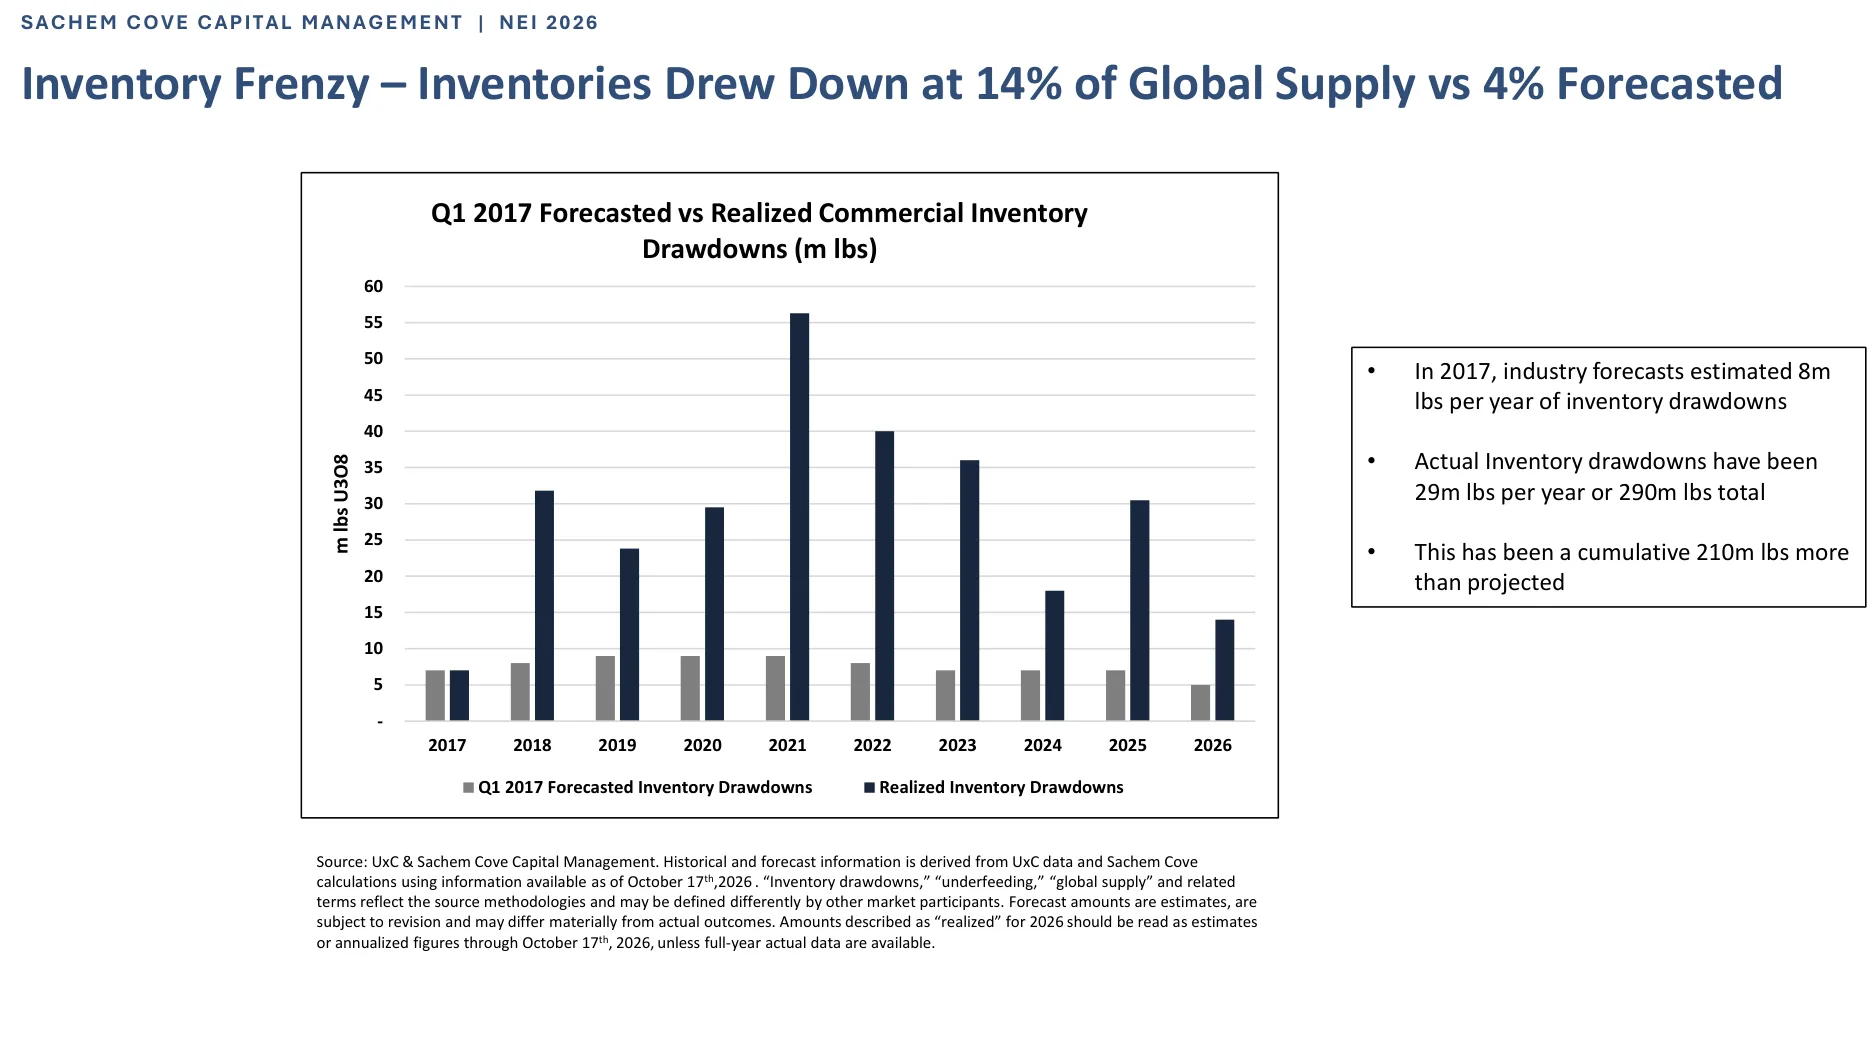
Figure 2. Commercial inventory drawdowns greatly exceeded the 2017 forecast. Sachem Cove estimates actual
drawdowns at about 29 million pounds per year, or 290 million pounds in total, versus an expected 8 million pounds
annually. Figures are based on the presentation’s methodology and data available as of October 17, 2026; 2026
values may be estimates or annualized figures. Source: slide 5.
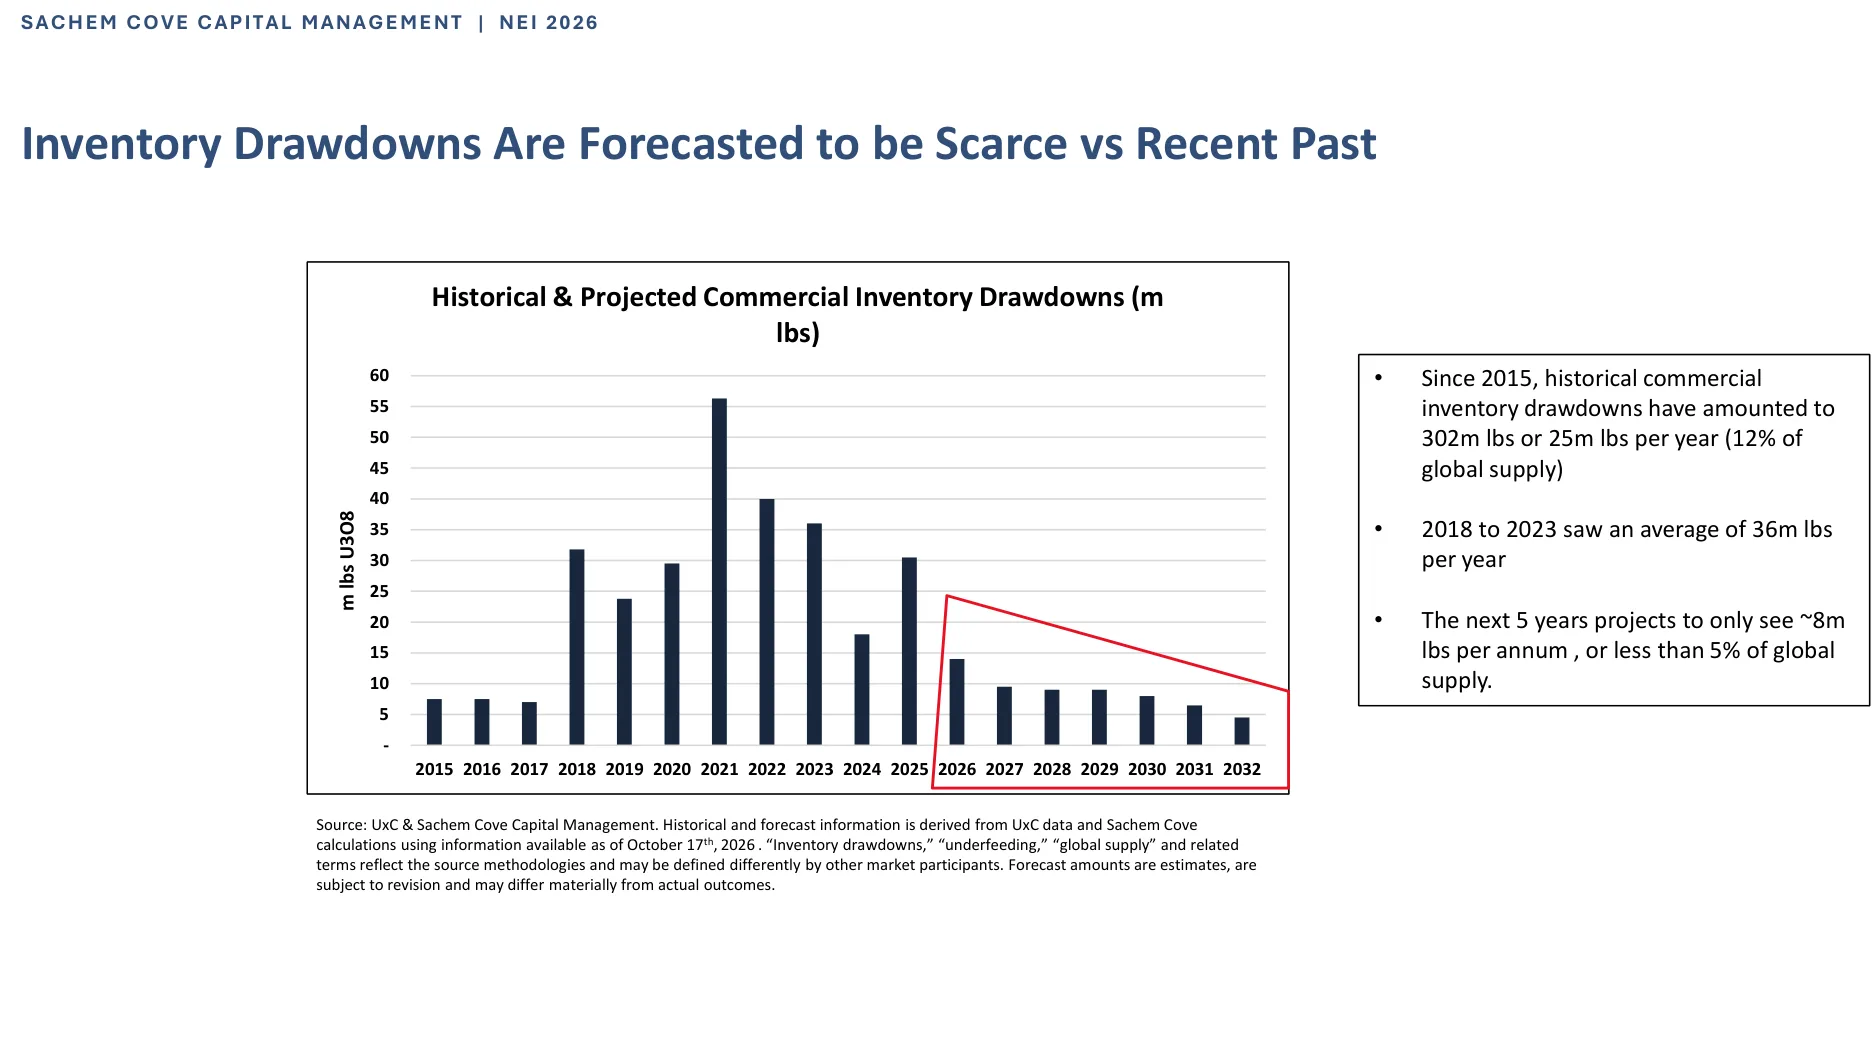
Figure 3. Underfeeding was a meaningful source of supply in the second half of the 2010s but is projected by
Sachem Cove to contribute a much smaller share of global supply over the next five years. Source: slide 7.
Inventories are not all equally available
One of Alkin’s most important qualifications is that headline inventory totals do not tell the whole story. The question is not only how many pounds exist above ground, but who owns them, why they hold them, and what price would persuade them to sell. This is the concept of inventory mobility.
The transcript describes how uranium spot prices rose from roughly US$17–18 per pound at the market bottom to around US$92 during the discussion, while reported long-term contract prices approached or exceeded US$100. These are the price references cited during the interview, not a real-time price update. For Alkin, the price response is evidence that inventories were less mobile than market participants had assumed.
Sachem Cove’s presentation estimates that commercial inventory drawdowns since 2015 amounted to approximately 302 million pounds, or about 25 million pounds annually. It contrasts that history with a projected average of roughly 8 million pounds per year over the next five years. Underfeeding is also expected to be much smaller than it was during 2015–2021. If inventory drawdowns and underfeeding both fade, the market has less flexibility to cover shortfalls. The implication is not that prices must rise in a straight line. It is that the supply stack becomes more dependent on actual mine output and on the price required to elicit additional production.
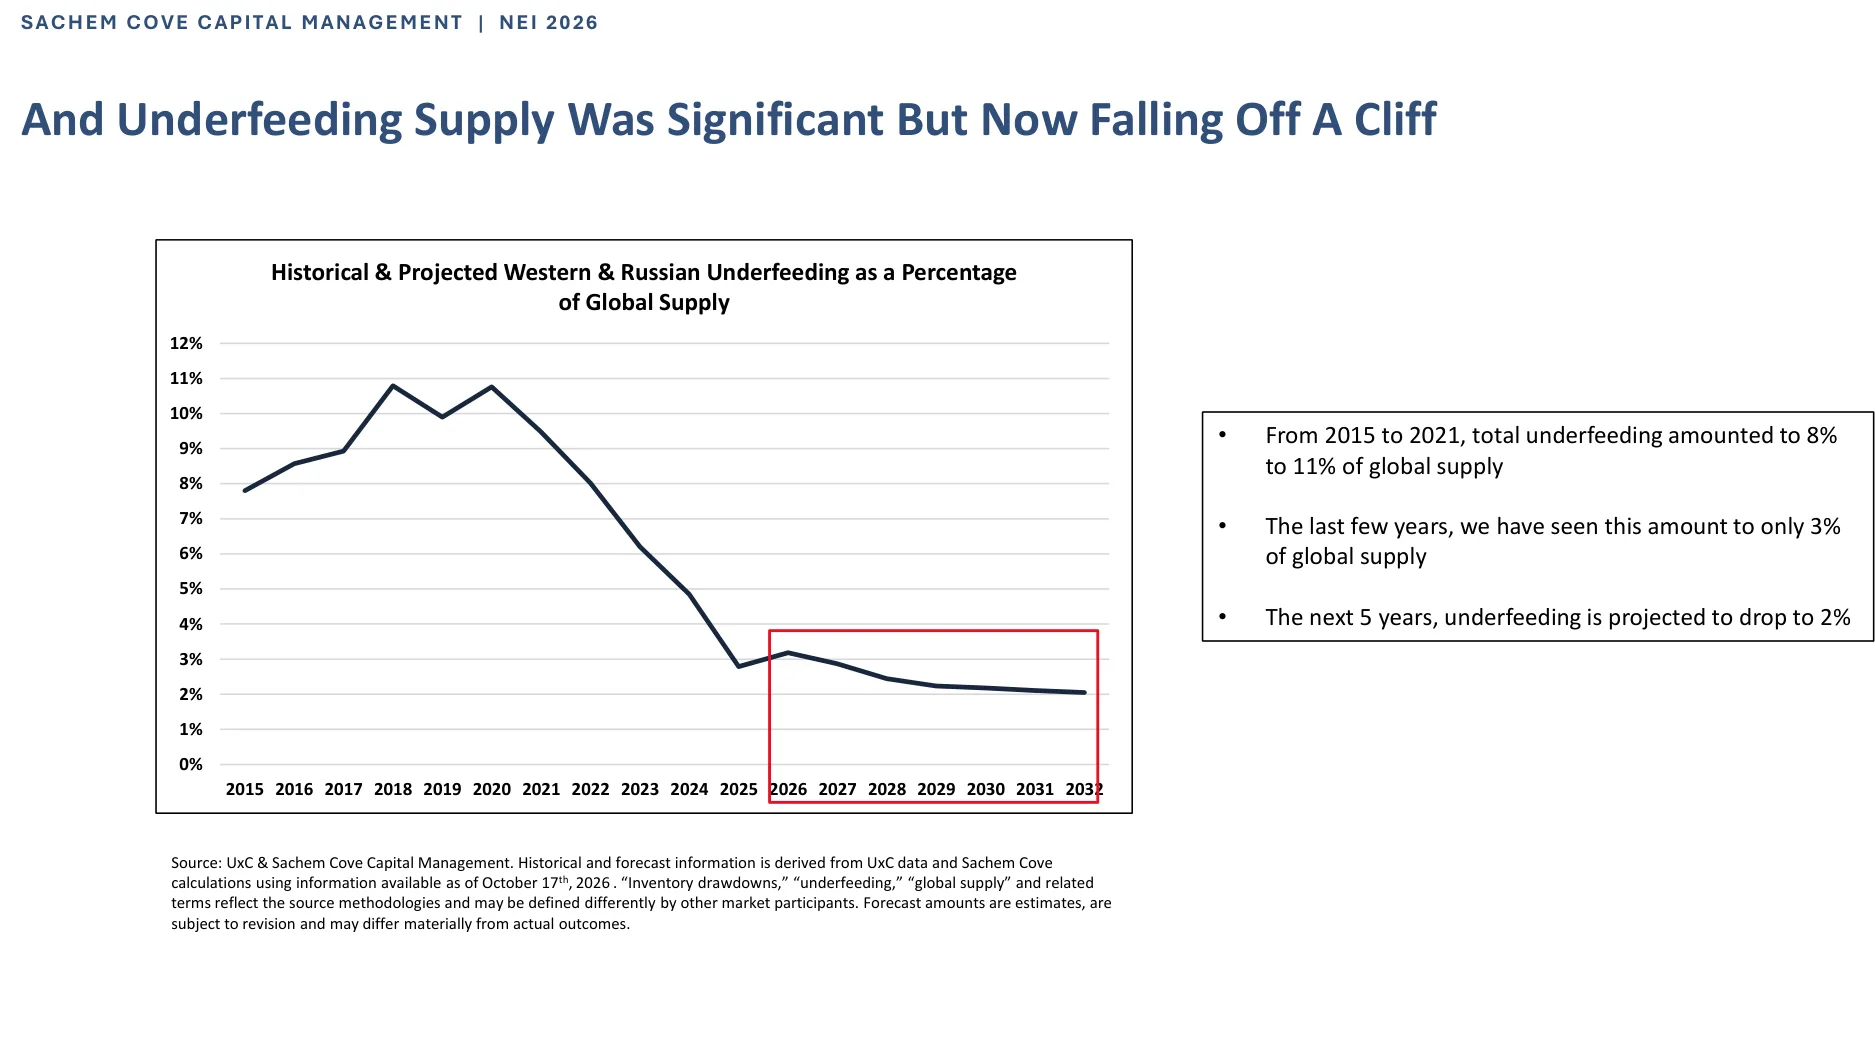
Figure 4. Sachem Cove’s presentation compares historical inventory drawdowns with a much lower projected pace.
The forecast is an estimate and could change as market conditions evolve. Source: slide 6
Why U.S. inventory comparisons can mislead
The interview also challenges the use of U.S. utility inventory levels as a standalone argument that the market is comfortable. Alkin says that comparing current inventory coverage with the previous bull market requires context, particularly the Megatons to Megawatts program.
Under that program, highly enriched uranium from dismantled Russian nuclear weapons was downblended for use as civilian nuclear fuel. Alkin described the arrangement as providing the United States with roughly 20 million pounds of uranium-equivalent supply per year until 2013. Utilities that expected this material to arrive had less reason to hold the same level of inventory or contract for replacement supply.
The present market does not have that same assured stream. Alkin therefore argues that inventory levels that look high in isolation should not be interpreted as proof of future oversupply. Inventory coverage is a snapshot; the more consequential questions are how much supply will be available in coming years, how much demand must be met, and whether inventory holders will release material.
He also points to history. During the 2000s uranium bull market, prices rose substantially before the second Cigar Lake flooding event in 2006, then surged as expectations for new supply deteriorated. Alkin recalls that the forward balance was still being presented as a surplus even after the disruption. In his reading, the episode demonstrates how supply forecasts can fail to capture the market’s sensitivity to delayed projects and the willingness—or unwillingness—of holders to sell.
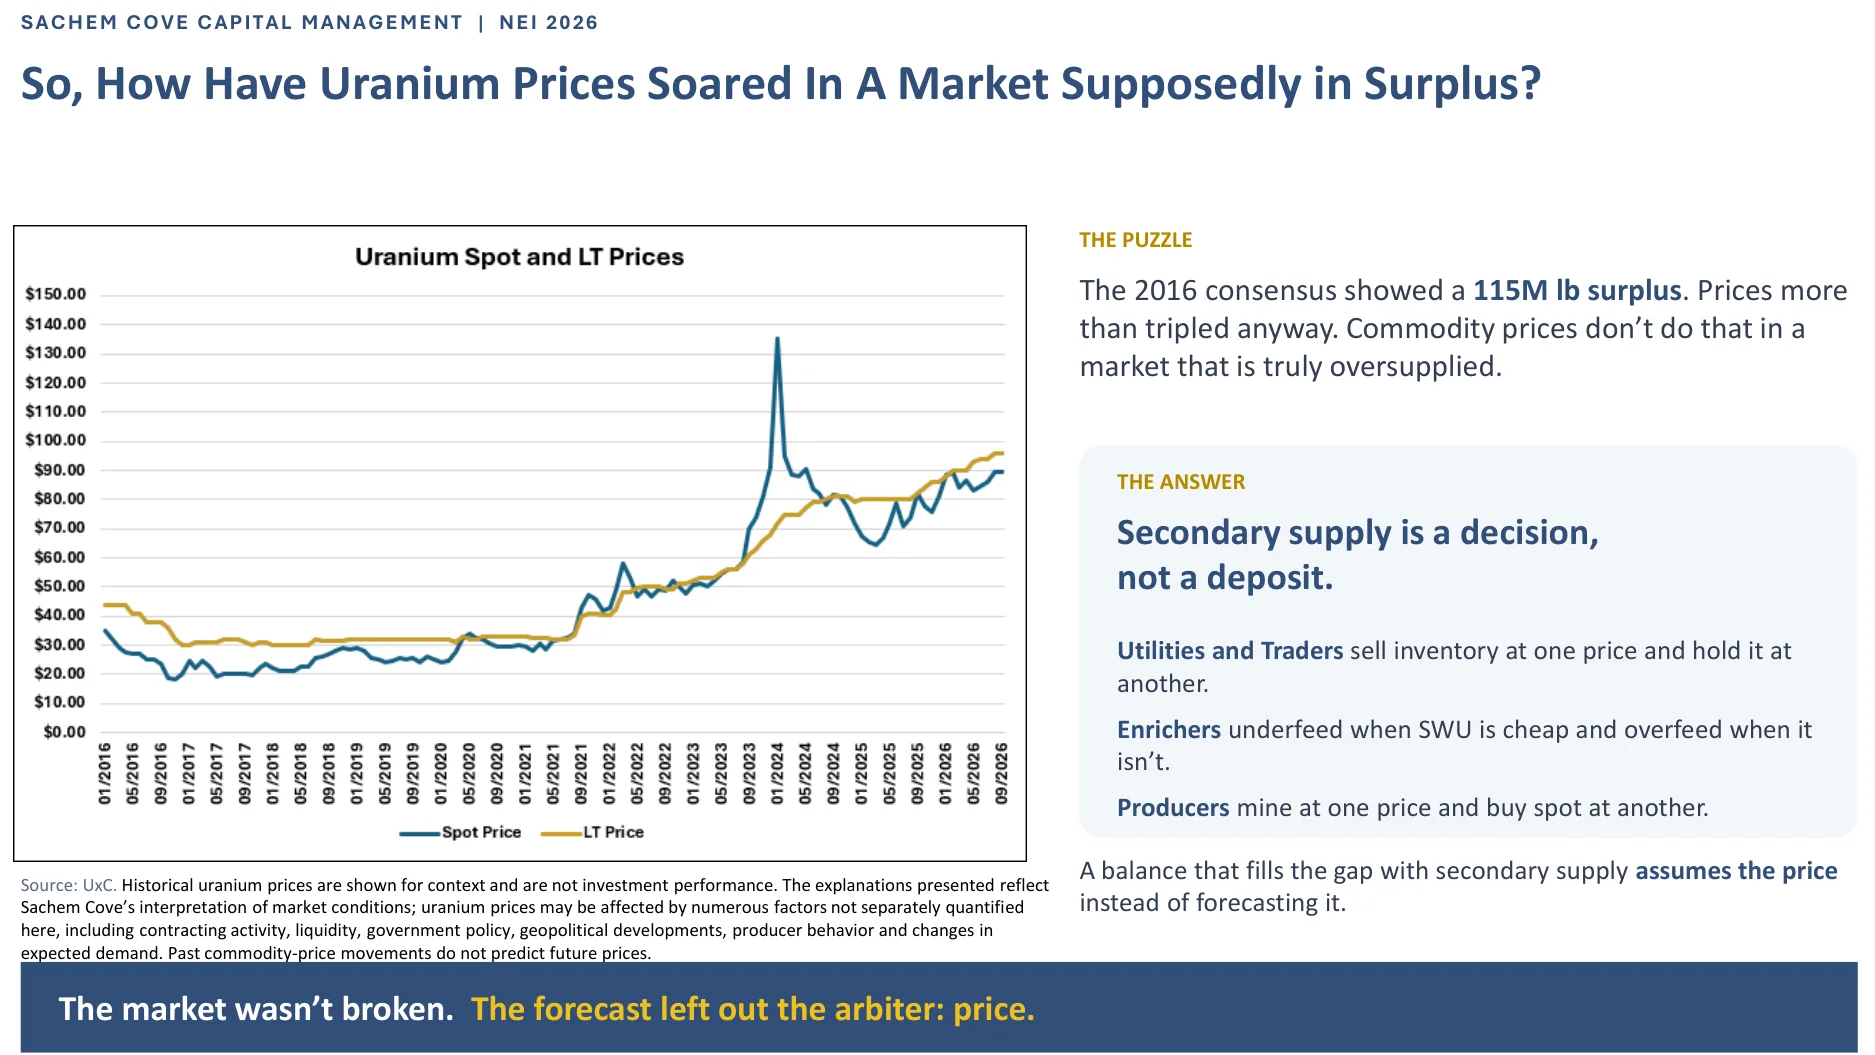
Figure 5. The presentation compares uranium spot and long-term prices with the earlier consensus balance.
Sachem Cove argues that prices rose despite a market widely described as being in surplus. Source: slide 9.
The cost curve: cash cost is not the cost of sustaining a business
Alkin’s second major argument is that the uranium industry’s cost curve has not kept pace with real operating conditions. In his view, cost estimates have often followed uranium prices: when prices were depressed, reported costs appeared to fall; when prices recovered, costs rose. The problem, he argues, is that some of the figures used in supply models capture only a narrow part of the cost of producing uranium.
A cash cost typically captures the direct cost of producing the next pound. An all-in sustaining cost (AISC) should go further, incorporating items such as sustaining capital, corporate overhead, sustaining exploration and reclamation. A full-cycle incentive price must go further still, reflecting the development capital, financing costs and risk-adjusted return required to build a new mine.
The definitions are not uniform across uranium companies, which makes comparisons difficult. A project can advertise a low operating cost while leaving out important expenses needed to keep the business operating, maintain production, replace reserves, fund permitting or finance future development. Alkin argues that cost curves based on incomplete or inconsistent definitions can understate the price needed to sustain the industry.
“You can’t run a mine if you can’t afford to run a company.”
The distinction also affects the supply response. A mine may be technically capable of producing uranium at a stated cash cost, yet still fail to generate enough cash to sustain the operation or justify the capital needed for expansion. For new projects, the price needed to justify construction may be higher than the cost figures most commonly cited in market commentary.
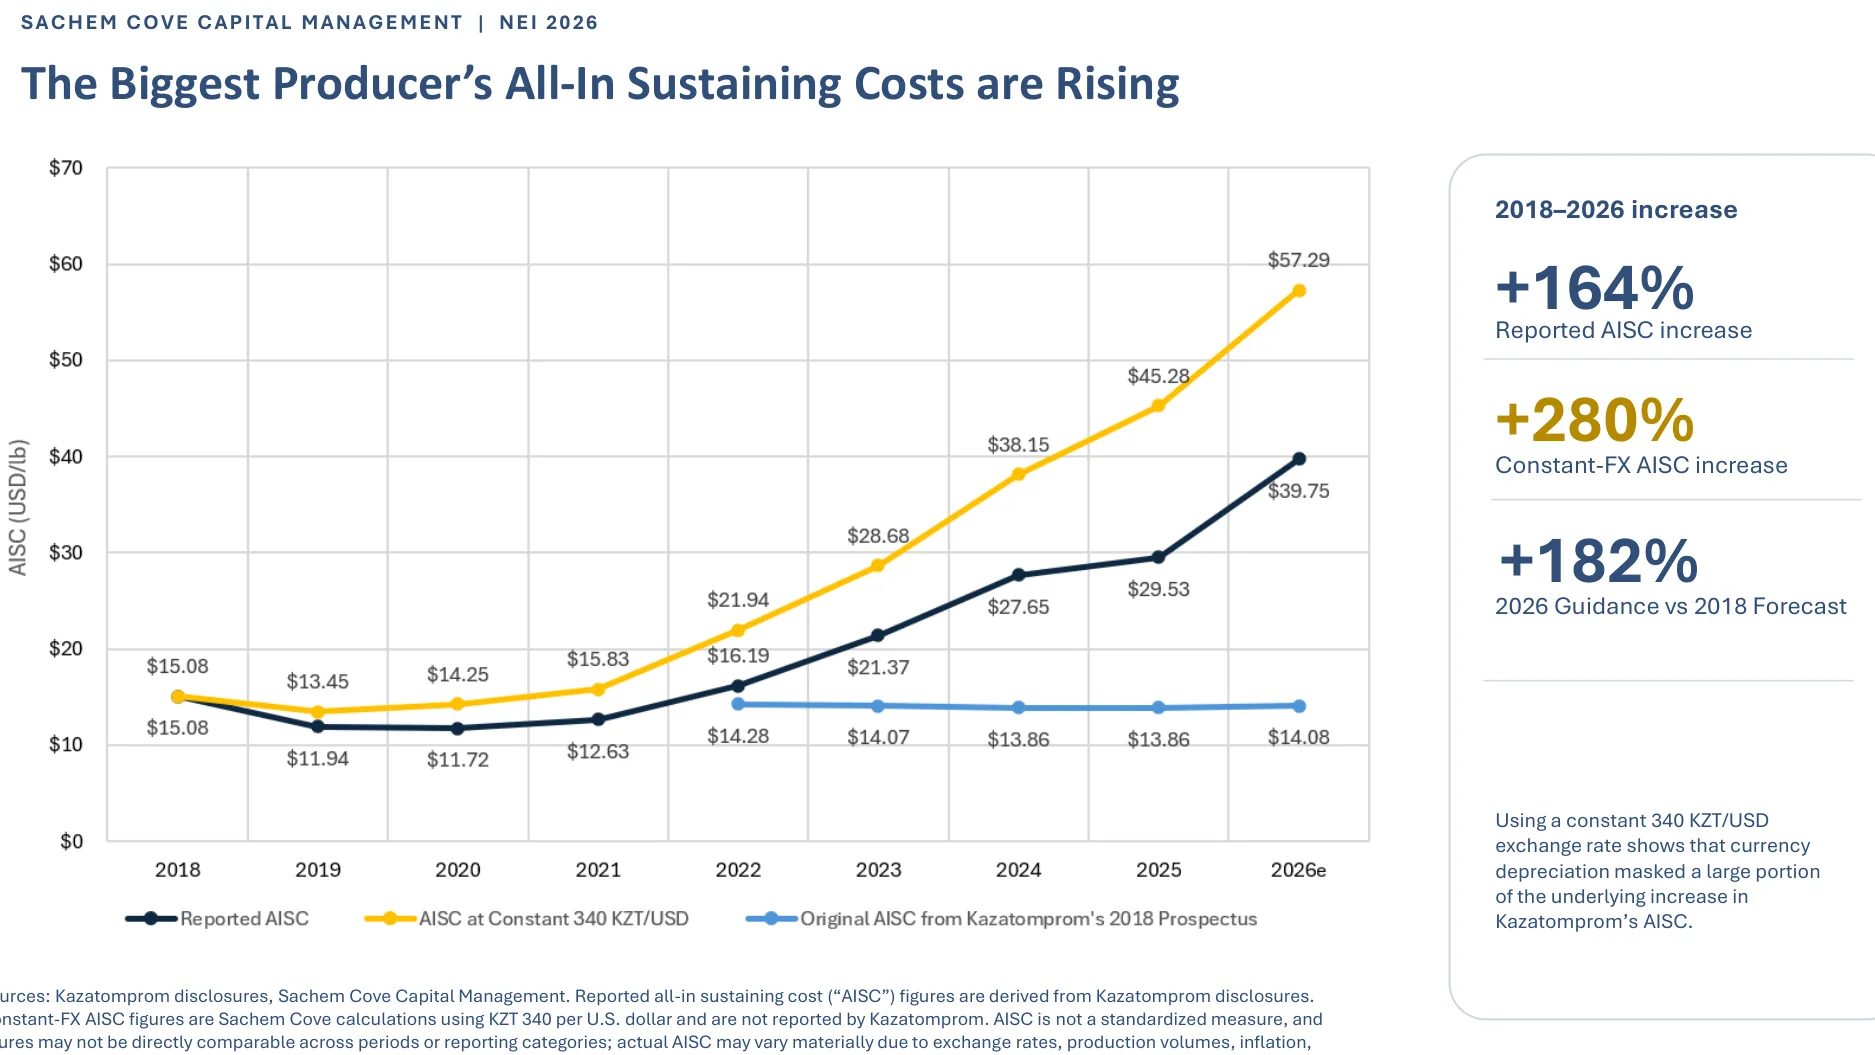
Figure 6. Sachem Cove’s analysis of Kazatomprom’s all-in sustaining costs shows a substantial increase between
2018 and 2026. The presentation reports a 164% rise on a reported basis and a 280% rise when adjusted to a
constant KZT/USD exchange rate. Constant-currency figures are Sachem Cove calculations, not company-reported
measures. Source: slide 13
Kazatomprom’s costs and the wider industry
Alkin uses Kazatomprom—the world’s largest uranium producer and a low-cost operator—as a key test of the industry’s cost assumptions. According to the presentation, Kazatomprom’s 2018 prospectus projected 2026 AISC of US$14.08 per pound. The presentation compares that forecast with a reported 2026 figure of about US$39.75 per pound and a constant-currency calculation of US$57.29 per pound.
Sachem Cove calculates that reported AISC increased by 164% between 2018 and 2026, while the constant-currency comparison shows an increase of 280%. The currency adjustment matters because Kazatomprom incurs many costs in Kazakhstani tenge while selling uranium in U.S. dollars. A weaker tenge can mask underlying cost inflation when costs are converted into dollars.
The presentation also compares production shortfalls and cost increases across a range of operations and projects, including Peninsula’s Lance, Ur-Energy’s Lost Creek, enCore’s Alta Mesa, Boss’s Honeymoon, Paladin’s Langer Heinrich, Cameco’s McArthur River and Kazatomprom. The projects differ in stage, currency, reporting period and cost definitions, so the comparisons are not perfectly like-for-like. Nevertheless, the collection is intended to show a broad pattern: some operations have produced less than earlier targets while costs have risen materially.
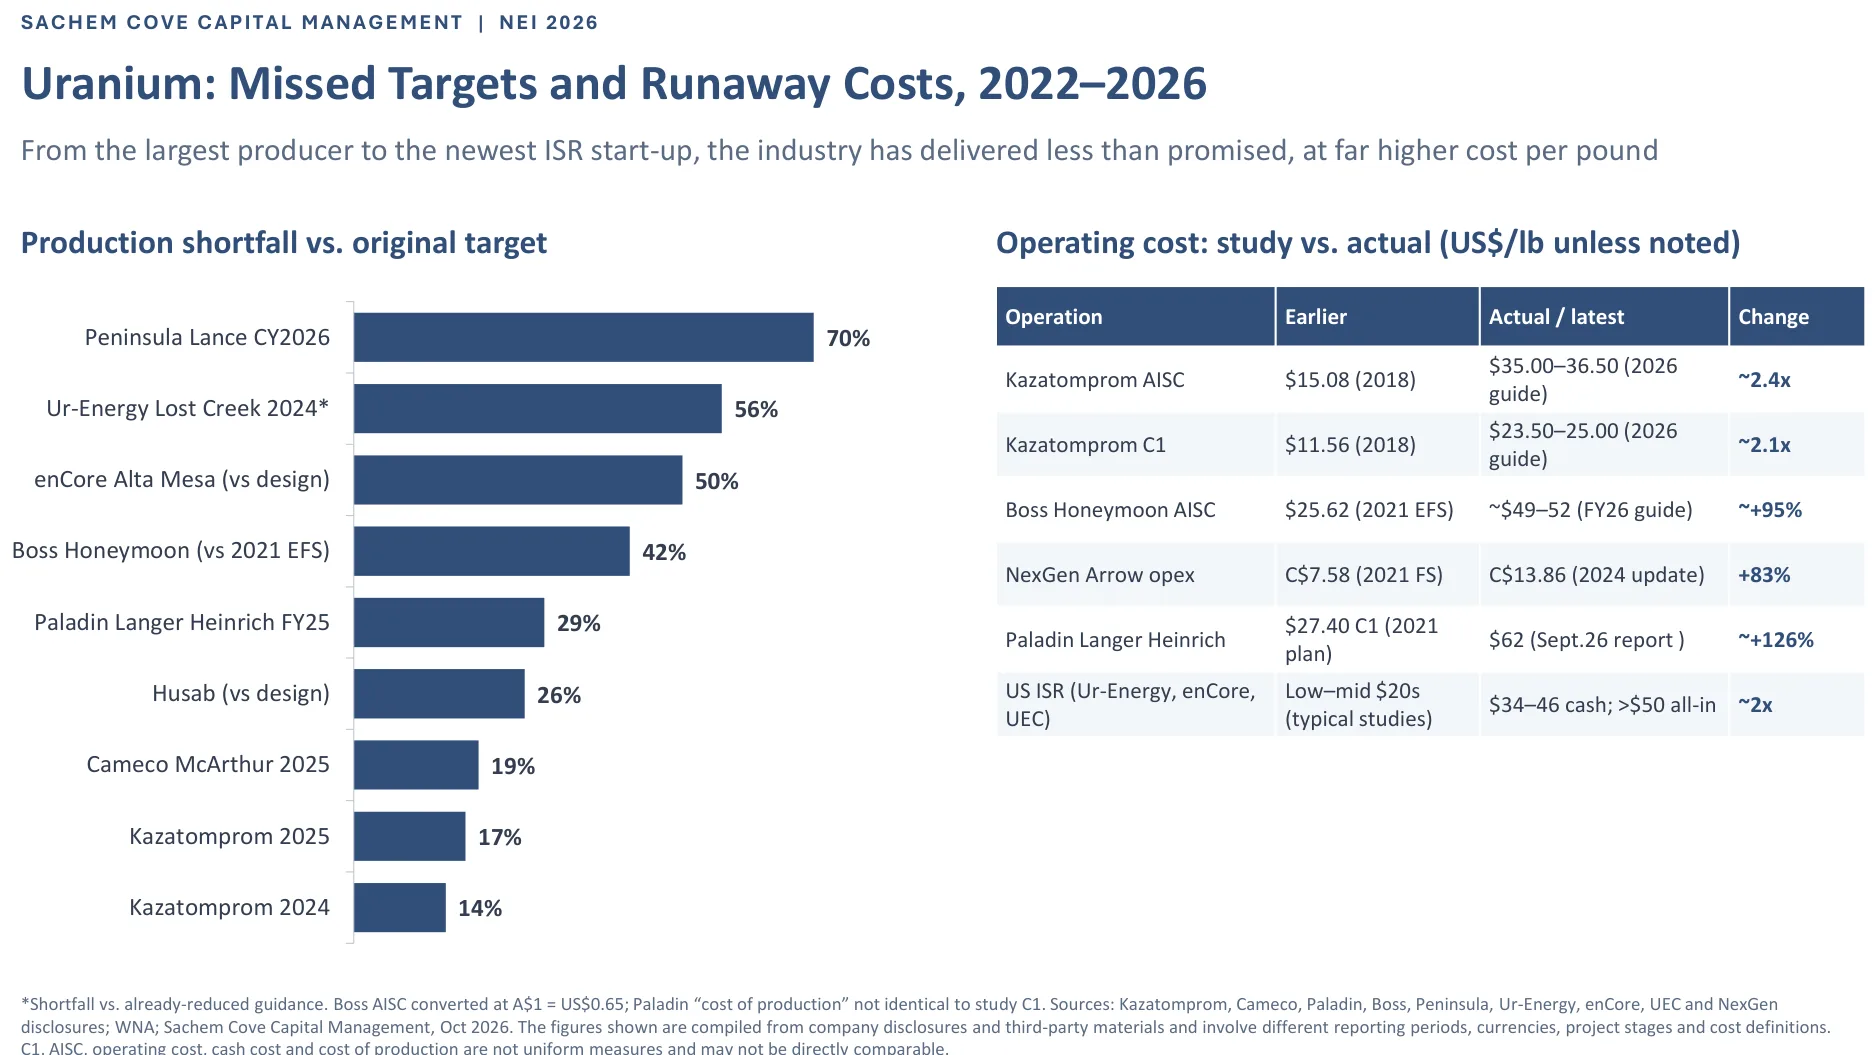
Figure 7. Selected uranium operations and projects: production shortfalls against earlier targets alongside increases
in operating-cost estimates. The presentation notes that project stages, currencies, periods and cost definitions
differ, so the figures should not be treated as uniform measures. Source: slide 15.
Why announced projects may not close the gap
The interview’s next question is whether the industry can deliver enough new uranium over the next five years. Alkin is cautious about taking project schedules and technical-report assumptions at face value. Mines are complex, capital-intensive developments; permitting, approvals, infrastructure, financing, construction and ramp-up can all push first production further into the future.
He notes that some projects once expected to begin production in 2023 have been pushed out to 2028 or even 2031. He does not attribute every delay to poor management, emphasizing that the development process itself can be lengthy. His concern is that supply models often aggregate announced projects as though their stated volumes will arrive on schedule.
Alkin also questions whether smaller, remote or technically challenging projects can achieve the low costs shown in their most optimistic scenarios. If the largest and most experienced producer is facing much higher costs than forecast, he argues, assumptions that a small project in a difficult location can deliver substantially cheaper pounds deserve scrutiny.
Even when a new mine is built, its production may not automatically flow to utilities at the price or on the timetable they expect. Developers may need to raise capital, secure financing or demonstrate commercial viability; utilities may use small contracts with emerging producers to preserve optionality without relying on those pounds as a central part of their fuel plan. Alkin’s broader point is that a project pipeline is not the same thing as dependable, economically viable supply.
Sachem Cove’s presentation summarizes the challenge with a list of assumptions that would all need to work in favour of a lower-price outcome: existing mines would need to deliver as expected, costs would need to moderate, new projects would need to arrive on time, and secondary supply would need to remain available. Alkin believes the market has not adequately accounted for the risk that several of these assumptions fail together.
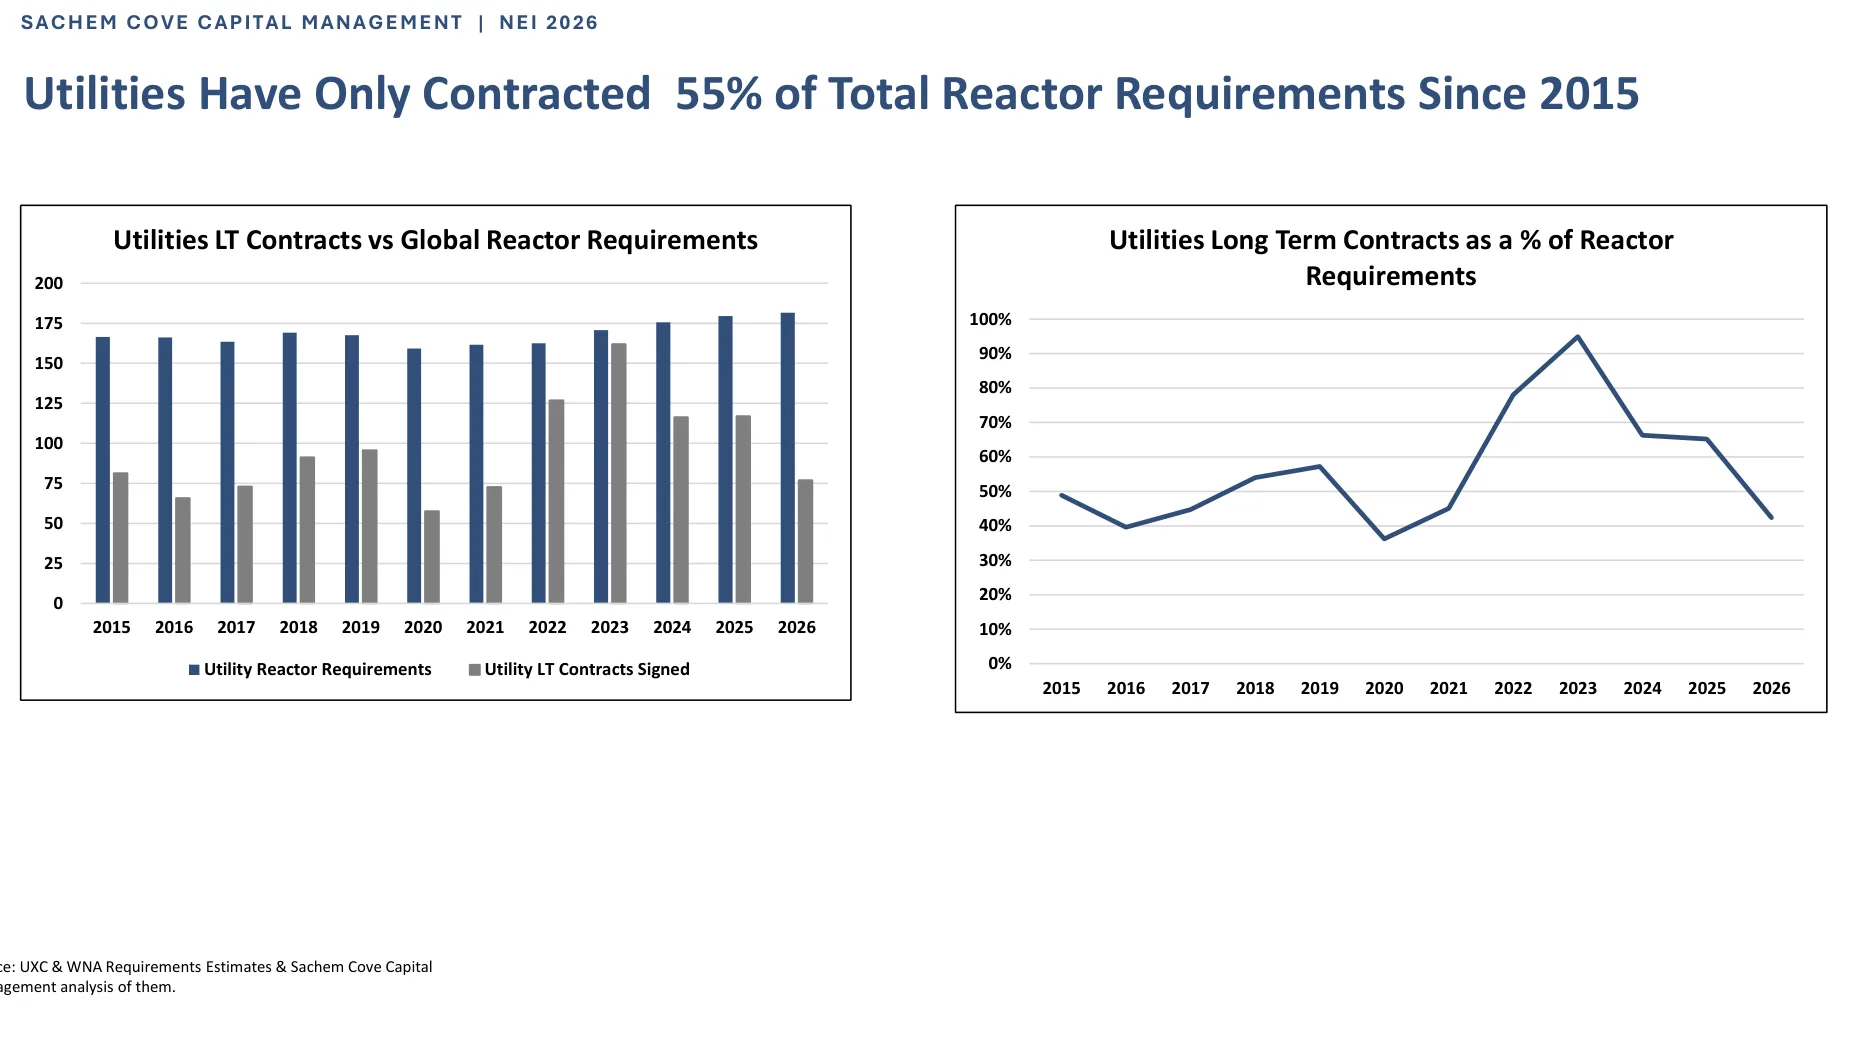
Figure 8. Sachem Cove frames the risk as a timing and deliverability problem: the danger is discovering too late that
expected supply cannot arrive when required. Source: slide 27
A deficit that does not depend on the AI narrative
Alkin estimates that structural deficits could range from roughly 15 million to 35 million pounds per year, depending on the assumptions and the year examined. He says Sachem Cove’s core model focuses on the existing reactor fleet, reactors under construction and the net effect of closures, rather than relying on additional demand narratives around artificial intelligence, data centres or small modular reactors.
That distinction is central to his argument. Nuclear power’s renewed appeal and potential new-build programs may add demand, but Alkin believes the existing fleet and already-under-construction reactors are sufficient to make the supply challenge meaningful. In other words, the bullish case does not need to depend on every AI-related forecast coming true.
The presentation also highlights that utilities have contracted for only about 55% of total reactor requirements since 2015, according to its analysis. Alkin argues that utilities spent years contracting at roughly half the rate at which they consumed uranium, drawing down inventories in the process. That strategy helped defer contracting pressure, but it also left the market needing to refill coverage as future requirements approach.
He is critical of the idea that a low percentage of uncovered requirements in any one year proves that the market is comfortable. In his view, the more important factor has been the limited economic supply response: contract coverage statistics did not reveal how much production would be viable at the prices then available.
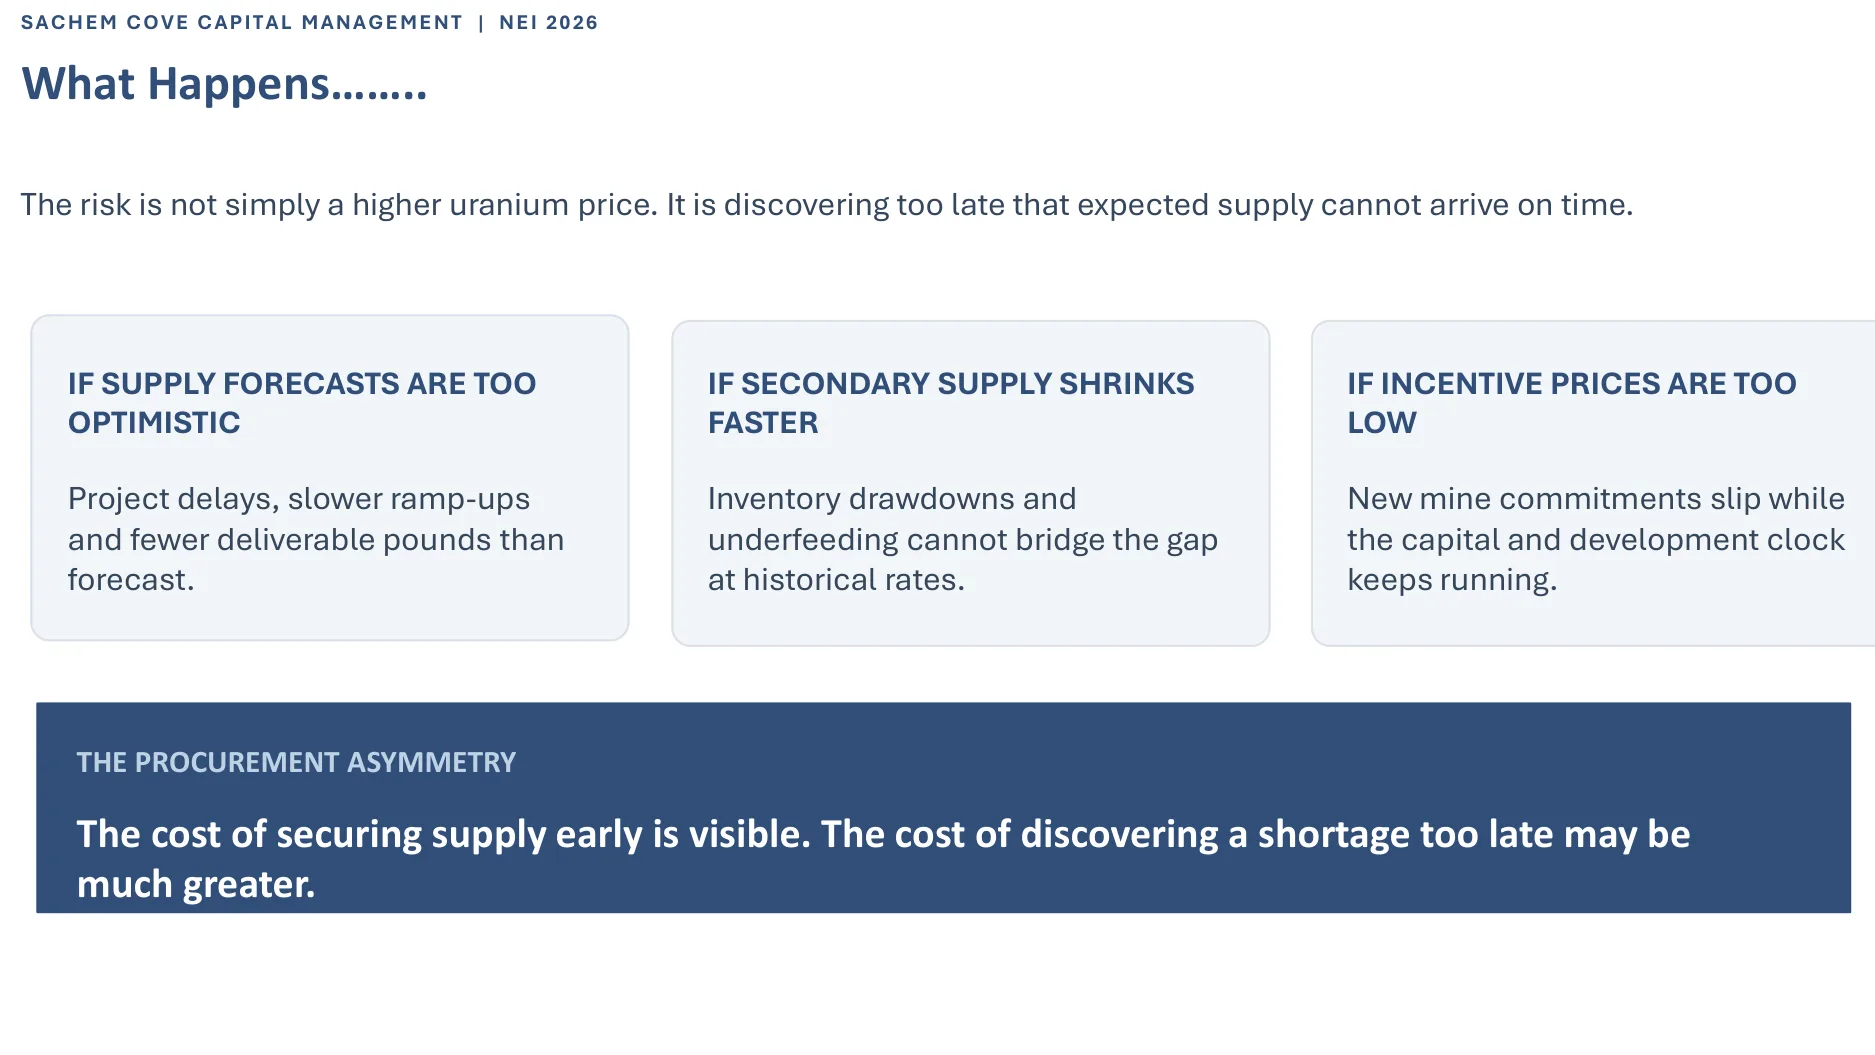
Figure 9. The presentation estimates that utilities contracted for approximately 55% of total reactor requirements
from 2015 onward, leaving a substantial portion of consumption to be met through other sources and inventory
drawdowns. Source: slide 25.
Strategic buying could tighten an already constrained market
The discussion also touched on several developments that were not included in Sachem Cove’s core supply-demand calculations: Kazakhstan’s consideration of a strategic uranium reserve, the U.S. government’s uranium procurement needs tied to national security, and Project UPRISE. Alkin said these initiatives could represent additional claims on available supply rather than sources that automatically expand production.
Kazakhstan’s reserve idea is particularly notable because the country is also the world’s largest uranium supplier. Alkin discussed the possibility that Kazakhstan may wish to retain uranium for its own future nuclear ambitions, including reactors expected to come online in the 2030s. If a major supplier chooses to reserve some material domestically, that could affect the pool of uranium available to international buyers.
On the U.S. side, Alkin said national-security procurement would require several million pounds annually, with the material needing to meet specific sourcing and eligibility requirements. The important point is not simply the headline volume, but whether those pounds must come from the same pool of current production that utilities already need.
He described these developments as potentially positive for price formation, while warning that investors should not assume every policy announcement translates directly into an immediate, fixed quantity of new demand.
Implementation, funding, eligibility rules and timing all matter. “Secondary supply is a decision, not a deposit.” the wider point: secondary supply and strategic inventories are not passive, unlimited reservoirs. They depend on the choices of governments, traders, utilities and enrichers—and those choices can change when economics or national priorities change.
Contracting, price reporting and the thin spot market
Alkin argues that reported uranium contract prices can understate the price at which transactions actually clear. As
he described it, some reporting conventions emphasize the lowest price offered rather than the price paid in a particular deal. If a contract is completed above that lowest offer, the reported benchmark may not fully reflect the transaction’s economics.
He also cautions against treating the spot market as a complete measure of uranium demand. In the interview, he characterized spot as a relatively small, thin and sometimes illiquid segment of the market, with physical traders representing a significant portion of activity. That can make spot prices vulnerable to short-term flows and positioning.
At the same time, Alkin said spot-market firmness during the months leading up to the interview appeared to reflect genuine bids from a broader set of participants, including utilities topping up requirements. He described spot prices as having risen roughly 10%–13% during the year and the term market by somewhat more; these were his estimates during the conversation, not independently updated figures.
For utilities, the long-term market remains crucial because most reactor fuel needs are met through contracts rather than continual spot purchases. As coverage needs to be rebuilt and credible supply becomes more valuable, contracting behaviour may matter more than daily movements in spot prices.
Alkin’s practical message to fuel buyers was blunt: repeatedly using small, low-volume contracts to hold down reported prices is unlikely to solve a structural shortage. If the pounds are needed, utilities ultimately have to secure reliable supply.
Why uranium equities can fall while the fundamentals remain tight
The final part of the conversation addressed a disconnect that many uranium investors have experienced: equities can decline even as the supply-demand thesis appears to strengthen. Alkin identified several forces that can pressure share prices without immediately changing the underlying uranium balance. First, market narratives can dominate flows. Uranium stocks have increasingly been grouped into broader AI, data-centre, power and new-build themes. When investors become concerned about spending plans, project announcements or the pace of new reactor commitments, uranium names can be sold as part of a theme—even if the uranium required by operating reactors remains unchanged.
Second, higher interest rates weigh on capital-intensive mining companies. Many developers and explorers do not generate operating cash flow and need external capital to advance projects. A higher cost of capital can depress valuations and make investors less willing to fund long-duration assets.
Third, uranium stocks can be caught in broader risk-off selling, geopolitical uncertainty, and the short-term positioning of multi-strategy funds. Alkin noted that some investors focus on quarterly catalysts and set expectations for announcements or new-build commitments. If those milestones do not arrive on the expected schedule, capital can leave the sector.
He rejected the notion that Russia is simply poised to flood the market with uranium if geopolitical conditions change, arguing that Russia also has domestic and international reactor commitments and remains a significant participant in enrichment. More broadly, he warned that a compelling long-term thesis does not prevent volatility, nor does it eliminate the need to reassess assumptions.
“We’re not here because we’re uranium enthusiasts. We’re here because there’s an asymmetry.”
Alkin said his team continually tests its thesis by starting from the possibility that it is wrong. His position, as expressed in the interview, was that the central supply-demand facts had not changed enough to invalidate the thesis—but investors must decide for themselves whether they have the conviction and risk tolerance to remain invested through deep drawdowns.
What investors should watch next
Actual mine production versus company guidance, especially at large established operations and new ISR projects.
Updates to operating, sustaining and full-cycle costs—not just headline cash costs.
Permitting, financing, construction and ramp-up milestones for major development projects.
The pace of utility contracting relative to reactor consumption and the amount of forward coverage being rebuilt.
Commercial inventory drawdowns and whether holders are willing to release material at prevailing prices.
Changes in enrichment economics that could reduce underfeeding or increase uranium feed requirements.
The practical implementation and timing of strategic procurement or reserve policies in Kazakhstan and the United
States.
The difference between reported contract benchmarks and the prices implied by actual transactions.
The bottom line
Alkin’s thesis is not simply that nuclear demand is growing. It is that the uranium market’s apparent resilience over the past decade relied on a combination of mine production, inventory liquidation and underfeeding that may not be repeatable. At the same time, operating costs have risen, projects have missed production targets or slipped in schedule, and the industry’s cost disclosures do not always capture the full economic burden of sustaining and replacing supply.
If the inventory bridge narrows while underfeeding fades, the market may become more sensitive to the cost and reliability of primary production. That does not guarantee a straight-line rise in uranium prices, and the interview’s forecasts remain Sachem Cove’s interpretation of an uncertain market. But it does put the spotlight on a crucial question: not how many pounds appear in a spreadsheet, but how many pounds can be delivered, on time, at a price that makes economic sense.
For investors, the key is to separate short-term equity-market narratives from the underlying fuel market while continuing to test the assumptions. As Alkin emphasized, conviction should come from the evidence—not from enthusiasm for the commodity.
Expanded Interview Analysis: The Additional Issues Shaping Uranium’s Next Cycle
